Monitoring on Kubernetes
Gain insights into the significance of monitoring for observability in cloud-native systems. Discover how monitoring tools empower DevOps engineers to track application performance and infrastructure metrics, ensuring availability and meeting performance expectations. Stay ahead with proactive alerts and scale-out observations for optimized operations.
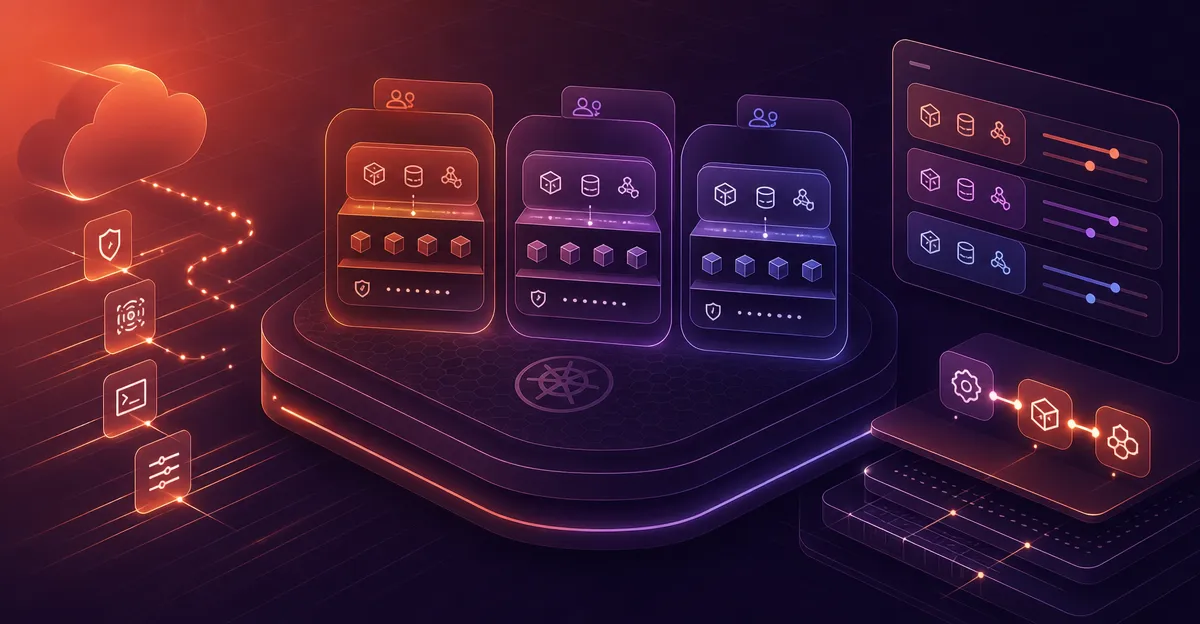
Monitoring is an important component of observability. With all our applications running along-with the various tools, we need to keep an eye on each as well as the underlying frameworks and infrastructure. This helps us ensure and stay in the know of how each component is performing and whether they are achieving the availability and performance expectations that they are supposed to. Monitoring helps us gain insight into cloud-native systems, and combined with alerting it allows DevOps engineers to observe scaled-out applications.
Cloud-native systems by nature are ephemeral. They may be recycled at any time, be scaled up or down, triggering events in each case. And given the scale that they can grow to, the monitoring should not just treat any specific component independently, but rather be able to aggregate the results of the components.
Metrics
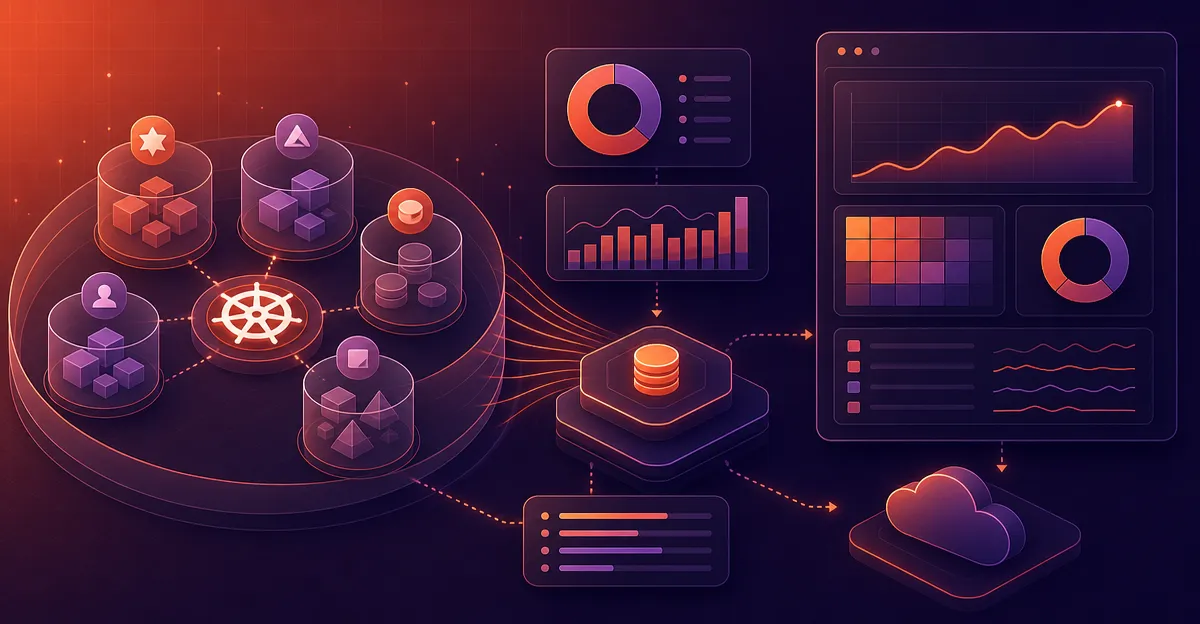
Metrics are the measurements that help give us a picture of the system is behaving and help us make informed decisions of whether there needs to be any change in the system to optimize the performance of the application as per expectations. Metrics are a combination of data from measuring multiple events. Cloud-native monitoring tools cater to different types of measurements by having various metrics. Some of these metrics may be cumulative metrics that can only ever increase. For others the value may go up and down over time and only a point-in-time value will be required. The idea is to aggregate similar events to gain a higher level of insight. Metrics are generally time based, therefore we usually collect metrics periodically, such as once per second.
Prometheus
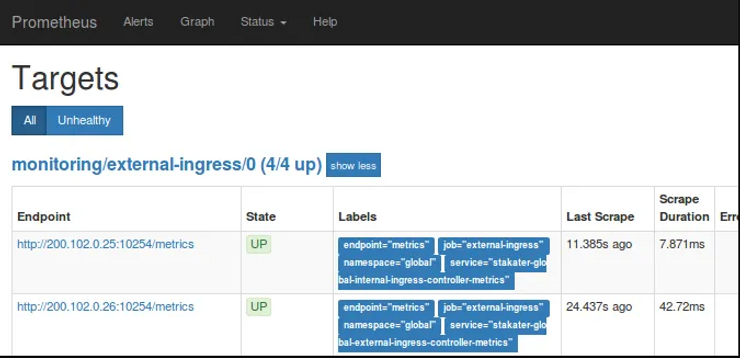
At Stakater, we use Prometheus as our monitoring tool. Prometheus is an open source toolkit for monitoring and alerting under the Cloud-native Computing Foundation (CNCF). Some of the key features that we like about it are that it pulls metric data from services and each service doesn’t need to push metrics to Prometheus itself. Therefore Services need to only expose endpoints where they publish their metrics, and prometheus will call this endpoint and collect the metrics by itself. Additionally service targets can be discovered either using service discovery or via static configuration. Prometheus’ powerful query language, PromQL, is helpful for selecting and aggregating time series data in real time. Prometheus itself has a rudimentary web UI where the status of the monitored services can be viewed, however Prometheus also exposes it’s monitoring results via a HTTP api which makes it easy for an external system such as a more advanced visualization tool to consume and process the metrics. One such tool is Grafana which we will discuss a bit later. To learn more about alerting with Prometheus in Kubernetes, check out our detailed blog post on alerting in Kubernetes.
Deploying and configuring Prometheus can seem a bit daunting at first but using Prometheus Operator it becomes quite easy.
Prometheus Operator
An Operator is a convenient method of deploying and managing an application on Kubernetes. Using some Custom Resource Definitions, we are able to easily configure the deployment we would like, and the Operator takes care of the heavy lifting of actual deployment work.
Prometheus Operator in this way makes the Prometheus configuration Kubernetes native and manages and operates Prometheus clusters. We can easily provide monitoring definitions for Kubernetes services and deployment and management of Prometheus instances. With the operator, we can easily create or destroy Prometheus instances, configure our Prometheus deployment with settings such as versions, persistence, retention policies, etc. And we can also use it to automatically generate monitoring configurations based on Kubernetes labels, and easily define the targets we would like to start monitoring.
The Operator ensures at all times that a deployment matching the Prometheus resource definition is running. The Operator also automatically generates Prometheus scrape configuration based on the definition of ServiceMonitor. And in case we need to modify the Prometheus stack deployment, instead of modifying each component Deployment or StatefulSet, we simply customize the CRDs and let the operator handle the orchestration.
Monitoring Applications
Monitoring Services
Prometheus consumes metrics that are exposed by services through http(s). We therefore don’t need to install any service agent, just expose a web port to reach our service’s endpoint and Prometheus server will regularly scrape the endpoint. The metrics format itself is in json which is easily readable by a human.
For any service that may not be natively integrable, it can be easily adapted using a Prometheus exporter. An example of this is the Node exporter that we will discuss shortly, which is used to expose hardware/os metrics from a node for prometheus to consume.
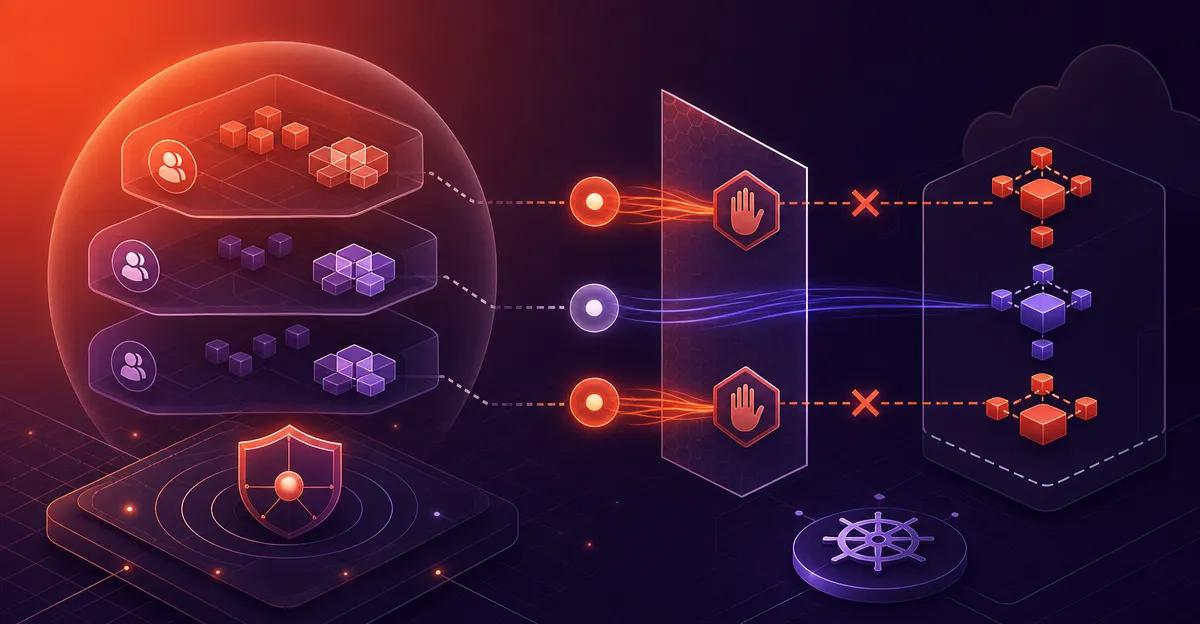
The Prometheus object filters and selects ServiceMonitor objects, which in turn, filter and select Prometheus metrics endpoints. If there is a new metrics endpoint that matches the ServiceMonitor criteria, this target will be automatically added to all the Prometheus servers that select that ServiceMonitor.

Monitoring short-lived jobs
While any regular applications will always be alive, and therefore their service will be available to be scraped periodically, a short-lived job may not be available long enough for prometheus to scrape it at the configured interval. For such cases, we have the Prometheus pushgateway which is a metrics cache. Any short-lived jobs can push their metrics to the pushgateway, from where they can be scraped by Prometheus server at the next scraping interval. Client libraries are available for a few platforms such as java, go, etc. so relevant jobs can easily push their metrics to pushgateway. The Prometheus text protocol however makes it so simple to push metrics that a script can even use a command-line HTTP tool like curl to send metrics.
Monitoring Cluster
Prometheus can be used in pro-actively monitoring the Kubernetes cluster. This provides cluster visibility and help with capacity planning. The cluster activity can be available on a metrics dashboard, and can subsequently also be used to trigger alerts and notifications. Stakater provides Kubernetes Platform Assessment services to help you understand your cluster’s performance and security. For more on securing your Kubernetes infrastructure, continue reading our blog post on security in Kubernetes and the cloud.
The following Cluster components can be monitored:
-
Orchestration level metrics — Deployment state, resource requests, scheduling and api server latency, etc.
-
Kubernetes nodes — classical sysadmin metrics such as cpu, load, disk, memory, etc.
Monitoring Kubernetes Objects
`kube-state-metrics` is a simple service that listens to the Kubernetes API server and generates metrics about the state of the objects. It listens to the Kubernetes API server and generates metrics about the state of the objects such as deployments, nodes and pods, which the prometheus server can scrape. This is useful to present orchestration metadata i.e. statuses of deployments, pods, replica statuses, etc.
Monitoring Kubernetes nodes
`Node_exporter`is a Prometheus exporter that exposes hardware and OS metrics for Prometheus server to consume. Some collectors are enabled by default in the Node exporter which may be enough to gather the required memory, Cpu and disk usage metrics for our requirements. The Node exporter is deployed as a daemonset when we use the Prometheus operator, so that it automatically covers all nodes in the cluster at any point in time.


Monitoring logging stack
At Stakater, we use Elastic stack for monitoring, and it can be quite important to monitor the performance and availability of the logging stack. Since logs are an important part of observability, we need assurance that there isn’t any gap in capturing them. Monitoring the logging stack will provide that visibility and transparency as to the performance and availability of the tools involved in the logging stack.
Monitoring Fluentd
Fluentd has specific plugins that can be used for making metrics available for prometheus scraping. The `prometheus` Filter plugin is used to read and process the incoming log records, and the `prometheus` Output plugin is used to do the same with the records being forwarded, in our case to elasticsearch. And the `prometheus` input plugin is used to exposed the metrics for consumption. Since fluentd will be running as a daemonset, each instance will expose the metrics of its current node. The metrics that we can export from fluentd can be number of total records, queue length, emit count, retry count, error count, etc. These metrics can give us an idea of the health of each fluentd instance relative to the load that it is meant to process.

Monitoring Elasticsearch
Elasticsearch is used to index the logs, and we also persist all our logs in the elasticsearch instance, it is therefore important to monitor it. We use a third party prometheus exporter for exposing Elasticsearch metrics. We capture metrics such as free space on block device, count of request cache hit/miss, percent CPU used by process, etc.
Visualizing Metrics
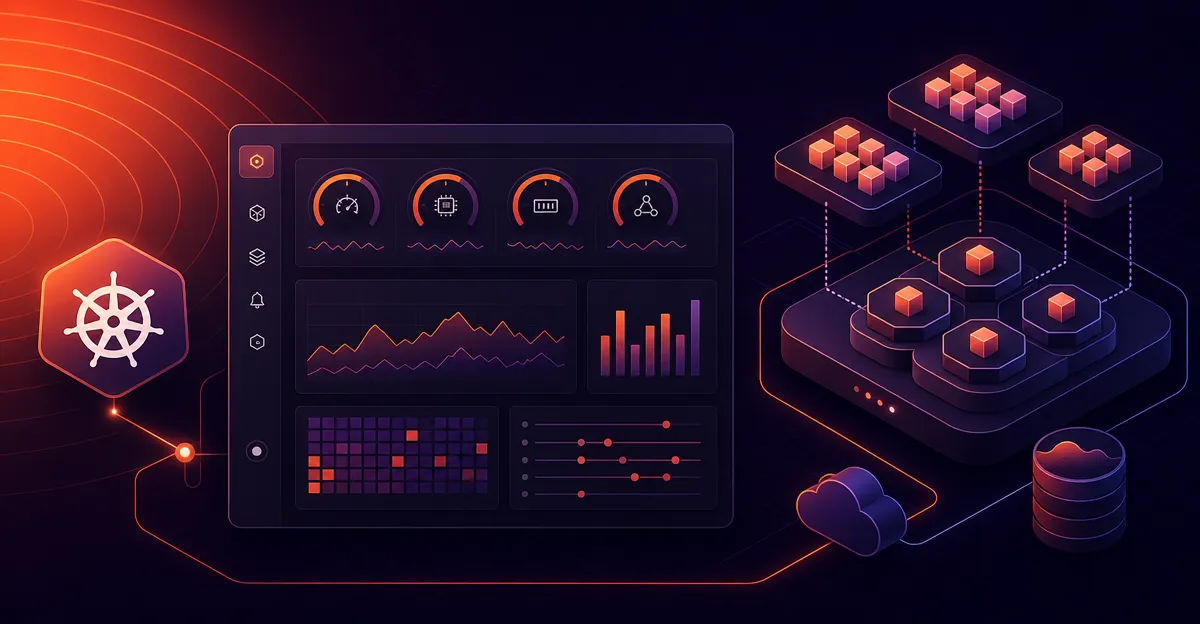
Prometheus metrics can be used for alerting based on specific thresholds, however visualizing the metrics even if they are not triggering alerting thresholds, is also useful. Grafana is one of the most popular visualization platforms and add-ons in the Prometheus solution. It pulls data from the Prometheus server and can display that in range of visualizations. The visualizations can also be grouped into custom dashboards. With a visualization tool such as this, the state of the system can easily be viewed by all stakeholders in the project team.


Summing up
The overall monitoring architecture will look as follows: