Automating uptime monitoring on Kubernetes with UptimeRobot
We explore UptimeRobot and the Ingress Monitor Controller (IMC) in Kubernetes. Discover how IMC automates the process of continuously monitoring ingresses created from deployed services across namespaces, seamlessly integrating with UptimeRobot. Say goodbye to manual monitor management as we discuss the benefits of leveraging UptimeRobot, along with other supported monitors like Pingdom and StatusCake
This is the third part of this current series of blogs. To explore earlier posts in our series, check out our guides on automating uptime monitoring with Pingdom and automating uptime monitoring with Statuscake. In this article, we will be looking at another Uptime checker that can be used for monitoring liveness of our services, UptimeRobot.
Ingress Monitor Controller (IMC) is a Kubernetes controller designed to continuously watch ingresses created from deployed services in all namespaces , and automatically add or remove monitors on UptimeRobot. This removes the manual task of managing monitors lifecycle. Other monitors supported are Pingdom and StatusCake.
UptimeRobot is a free monitoring service founded in Jan 2010 with a Pro Plan. It monitors your websites every x seconds/minutes and sends you alerts whenever the sites are down. This is how UptimeRobot works behind the hood:
-
It monitors website by asking for its headers and gets status codes like “200-ok”, “404-not found” every configured period of time.
-
It uses status codes from response, If the status code doesn’t match associated problem, then it is good.
-
If the status code is ~400+ and 500+, it means the site is not loading as expected. To make sure the site is down, Uptime Robot makes several more checks in the next 30 seconds
-
If the site has been confirmed to be down, it sends an alert through the Alert Contacts associated with the Monitor
Below are the interesting features of Uptime Robot
-
Has Multiple check methods : Uptime Robot uses HTTP(s), ping, port and keywords to check website status. If you have a web service listening on non standard port, you’ll specify service port when adding a Monitor.
-
Support many Alert Methods: Uptime Robot has support for SMS, Slack, email,Telegram, Twitter, HipChat, push and web-hooks alerting. A single monitor can have multiple alert contacts/methods.
-
Uptime Robot has a very easy-to-use API: With Uptime Robot API, you can get the details of your monitors, logs, create/edit/delete monitors, alert contacts and maintenance windows. Responses are provided as XML, JSON or JSON-P.
-
Advanced notifications: If you’re not interested with minor downtimes, you can Ignore them by setting “alert once (or every x minutes) if down for y minutes”
-
Flexible Maintenance windows: You can easily define time periods that you don’t want the services to be monitored, e.g. when doing site maintenance.
-
Verification from Multiple Locations: Uptime Robot Verifies downtime from multiple locations before final state of the service is reached.
-
Website stats: From the dashboard you can view uptime, downtime and the response times of all your websites. This helps a lot when analyzing whether the service meets customer’s SLA.
-
Access to Public status pages: This allows you to share the stats of your websites with your teammates and/or visitors
These features are fit for monitoring Kubernetes Ingresses and Services with the help of Ingress Monitor Controller.
Creating Uptimerobot Account
In case you’re new to Uptimerobot and would like to signup for a new account, head over to signup page https://uptimerobot.com/signUp. There is a Free Plan which provides:
-
5 minutes monitoring intervals
-
Upto 50 monitors
-
2 months of logs
You can start with the free plan the upgrade later depending on your business requirements. Provide username, email address and the password for the new account.
IMC requires API credentials to connect to Uptimerobot to push updates about Kubernetes Services/Ingresses. Obtain your API credentials by navigating to https://uptimerobot.com/login. Login to the dashboard and go to https://uptimerobot.com/dashboard.php#mySettings, near the bottom of the page, there is a section API Settings > Create the main API key.
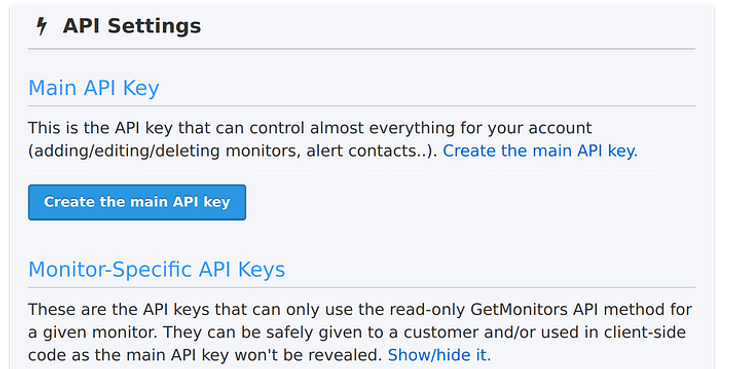
Save your Main API key as we will use it later.
Deploying Ingress to be monitored by IMC
By default, Ingress Monitor controller will ignore ingress definitions without IMC annotation added, and they will not be monitored. All ingresses to be monitored needs to have annotation below:
monitor.stakater.com/enabled: “true”
Here is a complete example of Nginx Ingress controller
apiVersion: extensions/v1beta1
kind: Ingress
metadata:
  namespace: test-namespace
  name: app-ingress
  annotations:
    kubernetes.io/ingress.class: "nginx"
    monitor.stakater.com/enabled: "true"
spec:
  rules:
  - host: app.example.com
    http:
      paths:
      - path: /
        backend:
          serviceName: app-svc-1
          servicePort: 80
Notice IMC annotation with true boolean under annotations. This will create an Ingress named app-ingress that serves from a service called app-svc-1
Deploying IMC to Kubernetes
Once you have created your Ingresse(s) with correct annotation, you can proceed to deploy IMC into your cluster.
Below are the steps to deploy IMC to your Kubernetes cluster using Vanilla Manifests files.
First, clone IMC code from Github:
$ git clone https://github.com/stakater/IngressMonitorController
Change to IngressMonitorController directory created from cloning.
$ cd IngressMonitorController
The vanilla IMC deployment manifests are located under *deployments/kubernetes/manifests.*Change your working directory to this path.
$ cd deployments/kubernetes/
In this directory there is a main IMC yaml file called ingressmonitorcontroller.yaml, this is the file you’ll edit to make all changes before deployment.
$ ls
README.md chart ingressmonitorcontroller.yaml manifests templates
Configure IMC for Uptimerobot Monitor
Provide the correct namespace name by editing ingressmonitorcontroller.yaml.
namespace: dev
Then Edit the data section of ConfigMap to provide Uptimerobot specific configurations
data:
  config.yaml: |-
    providers:
    - name: UptimeRobot
      apiKey: your-api-key
      apiURL: https://api.uptimerobot.com/v2/
      username: uptimerobot-email-address
      password: uptimerobot-account-password
      alertContacts: some-alert-contacts
    enableMonitorDeletion: true
    monitorNameTemplate: "{{.Namespace}}-{{.IngressName}}"
To create contact group on UptimeRobot, login and navigate to My Settings > Alert Contacts > Add Alert Contact
Select Alert Contact type from:
-
Email
-
SMS
-
Twitter
-
Web-Hook
-
3rd Party apps/services like HipChat, Slack, Telegram etc.
It is possible to fetch alert contacts from CLI using curl and Uptimerobot REST API:
$ curl -d “api_key=your_uptimerobot_api_key” -X POST https://api.uptimerobot.com/v2/getAlertContacts
Copy values of id field of your alert contacts which you want to use for Ingress Monitor Controller. If you have more than one contact, you’ll need to append _0_0 to and separate them by -. Let’s consider an example, suppose you have two contact groups with IDs 4567 and 4578. Value to be used on alertContacts: should look like below:
4567_0_0–4578_0_0
The enableMonitorDeletion option is used to safeguard to enable or disable monitor deletion upon ingress deletion. You may want to set it to false for environments that keeps resetting Ingress, but for same backend services.
When done making changes to the file, proceed to deploy IMC to Kubernetes using updated ingressmonitorcontroller file
$ kubectl -n dev apply -f ingressmonitorcontroller.yaml
configmap/ingressmonitorcontroller created
serviceaccount/ingressmonitorcontroller configured
clusterrole.rbac.authorization.k8s.io/ingressmonitorcontroller-role configured
clusterrolebinding.rbac.authorization.k8s.io/ingressmonitorcontroller-role-binding configured
deployment.extensions/ingressmonitorcontroller created
Confirm creation of IMC deployment and pod:
$ kubectl -n dev get deployments. | grep ingressm
ingressmonitorcontroller 1 1 1 1 1m
$ kubectl -n dev get pod | grep ingressm
ingressmonitorcontroller-ffdb9567b-wcjt8 1/1 Running 0 2m
Now that we have a running IMC pod, tail logs to see if there is any error:
$ kubectl -n test-namespace logs ingressmonitorcontroller-ffdb9567b-wcjt8
2018/08/08 16:29:55 Warning: KUBERNETES_NAMESPACE is unset, will monitor ingresses in all namespaces.
2018/08/08 16:29:55 Reading YAML Configuration
2018/08/08 16:29:55 Starting Ingress Monitor controller
2018/08/08 16:29:56 Monitor Name: test-namespace-http-app-svc-ingress
2018/08/08 16:29:56 Monitor URL: http://test1.example.com/
2018/08/08 16:29:57 Monitor Added: test-namespace-http-app-svc-ingress
We can confirm that the Ingress has been added to Uptimerobot for monitoring.

When an Ingress is deleted, the monitor will be removed from UptimeRobot as well.

From the screenshot above, you can confirm that there is no Monitor since the one we added earlier has been removed. Visit IMC Github page to check the code.
For insights into securing Kubernetes infrastructure and consultancy services, explore Stakater’s Kubernetes consultancy services and strategies to secure your Kubernetes infrastructure.